Friday, December 30, 2016

Weekly outlook for Jan 2, 2017

I said last week:  

It appears the 10 week cycle did top and turned down.  That down pressure from the 10 week cycle should continue into the new year.

  Can't do much better than that...

The 10 week cycle continues down.  The 5 week cycle is also down.  These two cycles should bottom by Monday Jan 9 and then turn up...


GL traders - hope you had a prosperous 2016.

Update Jan 03, 2017:  $gold


Sunday, December 25, 2016

Week of Dec 26, 2015 outlook

I said last week: "10 week cycle near top and should turn down in coming week.  I expect some weakness into Christmas".  Still under 20k on the Dow as we got some down days in the week.  So my expectations were fulfilled.

It appears the 10 week cycle did top and turned down.  That down pressure from the 10 week cycle should continue into the new year.  Some may be holding off taking profits until January since Trump has promised reduced taxes.  We'll see soon.

 
Have a pleasant week and happy New Year.

Dec 29 - UPDATE


FLD (line) touched from above, Potential sell off...


Sunday, December 18, 2016

Dec 19, 2016 weekly outlook

Less upside than I thought probable (DOW fell just short of 20K).  10 week cycle near top and should turn down in coming week.  I expect some weakness into Christmas.

Last week TSI showed a buy (green arrow), that has now reversed to a sell (red arrow).

Merry Christmas traders

Saturday, December 17, 2016

$gold 2017

Outlook for gold in 2017.  Bottoms in early 2017 and then some upside.....

GL gold bugs

Sunday, December 11, 2016

Dec 13, 2016 weekly outlook

Seems my charts may be off  (early bottom  by 2+ days).  Should know  by end of next week. 
Cycles should be up for the coming week.


Gl traders


2017 outlook

First the Bradley Siderograph:

1. standard window = week *after* the Bradley date: Most index turns (about P=80%) come late, i.e. in the week after the Bradley date. This is part of the end times phenomenon where ‘everything is delayed’, consistently observed since 2013. Reason: the battle of the powers of light & darkness (Armageddon), which are in a kind of deadlock. So the (new)standard window is the week *after* the Bradley date, the extended window is +/- 1 week.

2. polarity reversals: Most of the big Bradley turns (some P=80%) produce the *opposite* polarity in the indices, i.e. an important Bradley high usually becomes a stock index low.


Then cycle circle chart for 2017:


Happy New Year

Friday, December 2, 2016

Dec 5, 2016 weekly outlook

 I said last week "I expect a sideways market, odds may slightly favor a down week.". What happened?  DOW Industrials up about .1% (slight gain), SnP500 down about 1%, small cap R2K down about 2%.  Overall sideways with a down bias.   I think my call was close to market action.

This week the 5 week cycle should bottom by around mid week and turn up,  So for the week the market moves sideways with highs at the beginning or end of the week and lows mid week. Remember the other cycles are up so odds are the high will be end of the week, but the trend for the week is primarily sideways.


GL traders


Saturday, November 26, 2016

Nov 28, 2016 weekly outlook

Market continued advance.  As I said last week  " but still potential upside bias for the week as 5 week  cycle tops)".  Looks like the TSI may be topping and may roll over next week.  Remember the short 5 week cycle should be retreating (down) this upcoming week.  I expect a sideways market, odds may slightly favor a down week.


GL traders

Update Monday Nov, 28


Saturday, November 19, 2016

Nov 21, 2016 weekly outlook

I said last week: "As of now I am assuming the market bottomed and turned.  Given the new high in the DOW, highs in other indexes seem probable.  Still given the amount of movement up last week a pause next week would be possible before week end." 

Highs most indexes, but SnP500 was about 4 points shy of a new high.  By mid/end of week the market was losing upside momentum (as expected).  R2K out performed as focus was on smaller companies with little foreign exposure (Think Trump and potential tariffs of companies with none USA business).

Next week we have the 5 week cycle topping (upside momentum slowed, but still potential upside bias for the week as 5 week  cycle tops).


GL traders

Italy ETF

GDX - Gold miners


Saturday, November 12, 2016

Nov 14, 2016 weekly outlook

The one sure thing in the market is often it gives you  unexpected moves.  I said last week: "Election on Tuesday next week.  So it seems we have a setup for a potential BIG down day first two days next week."  Well that was almost right except we got a BIG down at night.  Election night there was a BIG move down (700 points or so in DOW futures).  I do not have an account to trade futures  so I was screwed.  From what I understand this was mainly foreign trading.

Come morning at the market open in the USA the BIG down was gone.  the market  spent Wednesday soaring. Continued the week going up (mostly).

  I said  "I will be watching closely for a bottom and pivot upwards."   No time to consider the turn in the market. Another miss because I was not fast enough.

I said "May buy a position in IWM if it looks like a bottom forming/formed."   Right idea but missed it.  A whole week of missing opportunities  Never been so right and wrong at the same time.

Hope you did better than I did....  At the end of the week with R2K up around 10% (RWM down 10%) I bought a few shares of RWM.

NOTE:  My chart last week was very much a bulls eye.

As of now I am assuming the market bottomed and turned.  Given the new high in the DOW highs in other indexes seem probable.  Still given the amount of movement up last week a pause next week would be possible before week end.

GL traders

Friday, November 4, 2016

Weekly outlook for Nov 7, 2016

Nine days in a row down.  Some support levels broken and week closed below those levels. 

Election on Tuesday next week.  So it seems we have a setup for a potential BIG down day first two days next week. 

Next week I sell my RWM (Russell 2000 Inverse ETF) position.  I will be watching closely for a bottom and pivot upwards. 

May buy a position in IWM if it looks like a bottom forming/formed.  Could take until around Thanksgiving  (2 weeks or so)  for that bottom to confirm....


GL traders

Friday, October 28, 2016

Weekly outlook Oct 31, 2016

Setup in place for a hard down week with FBI taking another look at Clinton Email scandal. Expect a bottom Nov 8-9?  Amazing how cycles has pointed to this possibility for months....


GL traders

Thursday, October 27, 2016

Oct 27, 2016 - Gold ready to run?

 Substantial break above 200 day MA.  See what it did last time this happened.

Friday, October 21, 2016

Oct 24, 2016 weekly outlook

The past week was flat (no downside bias as expected). 

The 5 week cycle tops mid week and then the 5, 10, 20, 40 week cycles are down.... We need to see a couple of weeks hard down if we are to get a 10% or better correction by mid November.

GL traders

$WTI Oct 21, 2015

Looks like oil is at/near a top and ready to pull back:

Good Luck

Friday, October 14, 2016

Weekly outlook Oct 17, 2016

I told you last week: "A mid cycle dip as the 5 week cycle bottoms and the 10 week cycle tops.  Possible mid week low because of this mid cycle dip. "  I believe that is a fair description of what happened during the week. 

Now we have the 5 week cycle up, but the other cycles (10 week, 20 week, 9 month)  are down.  So  the total evidence suggests a down week.   The fact that the past week's dip (SPX 2116)  was lower than the prior  dip (2119)  combined with two weeks  down suggest a change in  trend has taken place.


GL traders

Wednesday, October 12, 2016

Silver Oct 12,2016

Looks like a bottom for silver based on cycles and Fibonacci time line (89 and 34 days).  RSI down around 30 (marking a low?).


GL traders

/

Saturday, October 8, 2016

weekly outlook Oct 10, 2016

A mid cycle dip as the 5 week cycle bottoms and the 10 week cycle tops.  Possible mid week low because of this mid cycle dip.  The 20 week (and longer cycles) down.

Many chartists use Fibonacci numbers to try to identify CITs (change in trend).  34day Fibonacci indicates potential CIT early in November.


GL traders

Sunday, October 2, 2016

Oct 3, 2016 weekly outlook

The market refuses to go down and stay down.  Seems every time it goes down 150 DOW points it bounces 160 DOW points the next day.

I seem to be repeating myself in telling you the cycles are due to head down and bottom in 5-6 weeks.  Well the market should bottom .... 

Awww, what the heck, no need to repeat myself.  Reading cycles is not a perfect science as it requires interpretation of the data and trends (and beginning to think maybe I have it wrong, but there has always been corrections - the question is when and how much).


GL traders

Monday, September 26, 2016

September 26, 2016 weekly outlook

Time for cycles to trend down.....  I expect 1 1/2 months down (1/3 of cycle) from 4 1/2 month cycle,

GL traders


Saturday, September 24, 2016

Sept 26, 2016 outlook

Is  a picture worth a thousand words?  OK, here goes - why does it seem that uptrends go on and on past the cycle mid-point?  Because they do.  Years ago I was asking myself this.  So I did some research and discovered that on a time line for a cycle the cycle is not symmetrical but about  75% of the length of a cycle is spent advancing.   Shorter cycles may not show this asymmetrical tendency.

The first thousand words (1994-2002)


OK, you are a speed reader - here is another thousand words (2002-2009):

These are long cycles,  how about shorter cycles (2009-2012):


And current  market (4 1/2 months - estimate 3 months up and 1 1/2 months down):


OK, that is 4,000 words worth.  Seems clear to me point made that cycles are asymmetrical.  If you treat them as if they are symmetrical you may sell too soon or go ALL IN (that is the CON) just when you should be cutting long positions and/or buying some inverse ETFs as hedges.


GL traders

Saturday, September 17, 2016

sept 19, 2016 weekly outlook

The market was up, down, sideways during the week.  More up than down as the indices showed  gains for the week (loss for last 6 trading days). Lots of movement during the week, but not a lot for the week as a whole.  Next week we have central banks meeting so volatility may continue. Longer cycles down, shorter cycles up.   Still expecting  longer cycles to take control.


There are longer cycles that may push the indexes lower over the next 2-3 months.


GL traders

Friday, September 9, 2016

Weekly outlook Sept 12, 2016

"September is on the downside of the nine month cycle. The 4.5 month cycle has topped and turned down (dominant)." - September monthly outlook

Weekly outlook: "This week the 4.5 month cycle turns down after topping the past week" early on this call as late in week before "The 4.5 month and 9 month cycles should start gaining down side momentum so a slight downside drift is possible."

Bonus post on Kitchin cycle: "The market is at/nearing a major cycle  top."

Not perfect,  near miss on my calls. Now that the longer cycle (4.5 month) cycle is showing dominance (and 9 month also down) expect another down week.


I am asked how to set potential price(s):  A frequently used method is a Fibonacci sequence.


gl traders

Monday, September 5, 2016

Sep 2016 - Kitchin Cycle Top

The market is at/nearing a major cycle (Kitchin Cycle - Google it) top.  This cycle will not bottom for 20 more months (in 2018).  I have been asked about when I expect a bear market (if we get a 1 1/2 - 2 year recession then this could mark the bottom [Apr/May 2018] of a bear market). 

Note: the shortest cycle shown is the 4 1/2 month cycle (Wall Cycle - Google it)  on this longer term chart.  You can mentally place the shorter cycles I post on top of this longer term cycle....

So there you have it - a longer term potential market outcome.

GL investors

Saturday, September 3, 2016

Weekly outlook Sep 5, 2016

Definitely not the week I was expecting in the week ended.  Most major averages closed higher.  Not a lot higher, but higher whereas, I was calling for a pullback.

This week the 4.5 month cycle turns down.  I have been asked how do you determine what cycle is dominant.  One way is analyzing the Detrended Price Oscillator (DPO) for different cycle lengths.  I hope my effort to show this helps.

This week the 4.5 month cycle turns down after topping the past week, but all the shorter cycles turn up.  So I suspect a sideways move.  The 4.5 month and 9 month cycles should start gaining down side momentum so a slight downside drift is possible.

GL traders

Update: new chart to further illustrate price based on DPO:


 Hope this helps....

Thursday, September 1, 2016

September outlook 2016

September is on the downside of the nine month cycle. The 4.5 month cycle has topped and turned down (dominant). The longer 18 month cycle is up along with the shorter 5 and 10 week cycles.

Expect the month of Sept to show a downward bias as the dominant cycles (4.5 and 9 months) control the  bias of the market.  Also, there is an election and surprises in that arena could have short term impacts on the market.


GL traders

Friday, August 26, 2016

Weekly outlook Aug 29, 2016

The week just ended was down as expected.  Dow down the most (%) while the Nasdaq was down a small amount (%).  I had hoped (thought) we may see a larger move.

The coming week looks like another down week with a stronger move down as the dominant 4.5 month cycle moves mostly sideways in a topping action.  The other cycles are down.  Down move should complete by end of the week so if you are short (Inverse ETF?) you may want to clear position before week end.


GL traders

Friday, August 19, 2016

Aug 22, 2016 weekly outlook

I stated  last week  " It appears the week should show a down bias."  I was partially right as the NASDAQ was up for the week while other major averages were down.  Looks like the coming week should provide enough downside to consider a trade using an inverse ETF of Dow industrials, SP500 or Russell 2000.  All the cycles I show on my chart  except the 4.5 month (20 week, 100 TDs) cycle are down for the coming week.

GL traders

Sample short term (intraday) chart.  No cycle tools, denoted cycle (tops/bottoms) turns with vertical lines:

Friday, August 12, 2016

Outlook for week of Aug 15, 2016

Last week I stated  "Dow and SandP500 should make marginally new highs during the coming week".  Not only that but the Nasdaq set new highs.  The Dow Jones Transportation Average seems to be lagging.

In the coming week the 9 month and 10 week cycles are down.  The 4.5 month cycle is up.  The five week cycle is topping as the 2.5 week cycle bottoms.  Two longer cycles down,  one up. The right translation of the 9 month cycle (due to uptrend) should  be playing out.  It appears the week should show a down bias.


GL traders

Saturday, August 6, 2016

Outlook for week of Aug 8, 2016

The past week saw some new highs.  But, the market was down during first half of the week and then up as two short cycles bottomed mid week (just as I  thought would happen), Basically the market was flat for the week (no impressive break out).  We did get bigger moves (up and down) as I suggested would happen.

Dow and SandP500 should make marginally new highs during the coming week as more cycles up than down with the dominant 4.5 month cycle still up. TSI has a negative bias.


GL traders

Friday, August 5, 2016

Aug 2016 outlook

By mid August cycles should start to dominate to the down side.  By August 15 shorts (inverse ETFs) should be considered.  Currently market is over bought  and should start a correction by the 3rd week of August and this downturn should last into mid November......

GL traders

Friday, July 29, 2016

Outlook for week of Aug 1, 2016

DOW down for the past week, SP500 up a very small amount for the past week, NAZ performed best (up the most) for the week.  Overall the markets were sideways for the week with only DOW showing the expected downside bias.

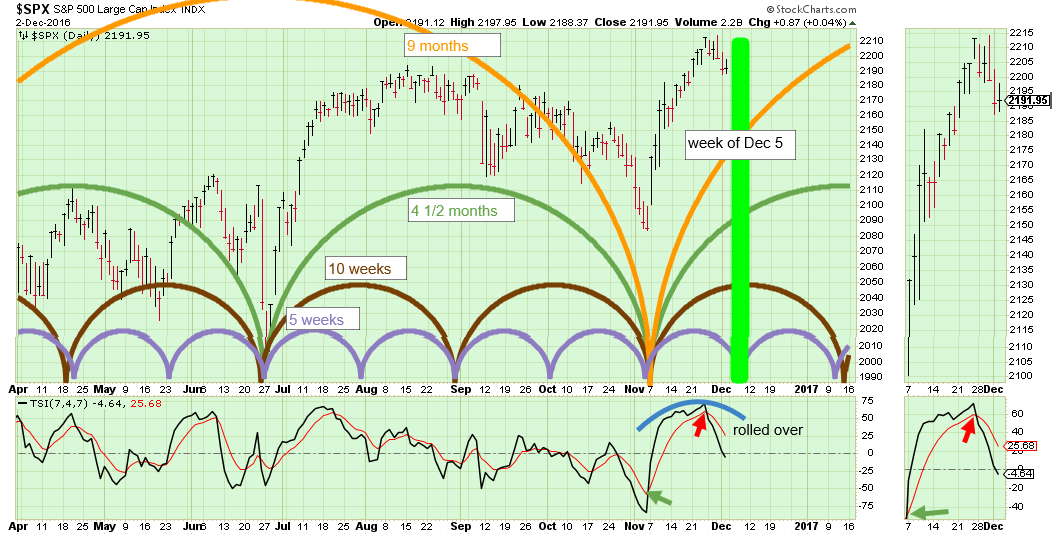
Next week we have cycles up, down, topping and bottoming.  Makes for a somewhat hard to interpret combination.  Appears market may be down to start the week as 2 shorter cycles bottom and up the last half of the week once the bottoming happens.  For the week expecting a sideways week with more movement down and up than the past 2 weeks,


GL traders,

Gold cycles do not correlate to the general market (like SPX).  Longer cycles are 1 year and 6 month cycles.  Appears 6 month cycle dominant.


6 month cycle up along with the 6 week cycle. 3 month cycle and 3 week cycles down. Given positive TSI I suspect an upside bias.

UPDATE 8,  3, 2016:  Other ways of looking for buy/sell  points:
1:  Multiple embedded envelops and intersection of upper channel lines (sell) and lower channel lines (buy).
2: DPO - Detrended Price Option shows when price gets too high (sell) or too low (buy)


Enjoy

Friday, July 22, 2016

Outlook for week of July 25, 2016

I said to expect a sideways market with an upside bias for the week.  That describes what we saw I believe as both the SP500 and DOW30 were both up less than 1%.  With the 40 week (9 month ) cycle being down and showing some dominance and the 5, 2.5  week cycles down (10, 20 week cycles up) expect a sideways market for the coming week.  The difference is - a DOWN side bias.  The market giveth one week and takes it back the next week!!!

Expect trading in a tight range.


GL traders

Update  July 27: As suggested the week is flat with down bias (so far)